


WASHINGTON — Real median household income in the United States climbed to a record high in 2025, while the official national poverty rate declined, according to annual economic report data released Tuesday by the U.S. Census Bureau.
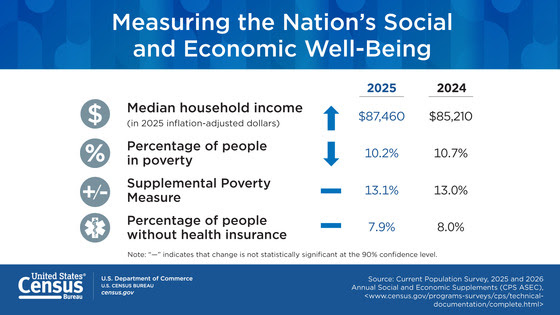
The annual data release—drawn from the 2026 Current Population Survey Annual Social and Economic Supplement (CPS ASEC)—presents findings across three comprehensive federal reports analyzing national income, poverty, and healthcare coverage.
Record Income Gains and Shifting Poverty Dynamics
Adjusted for inflation, U.S. real median household income rose to $87,460 in 2025, marking a 2.6% increase over 2024 levels. It stands as the highest median household income level recorded since the Census Bureau began tracking the metric in 1967.
Substantial improvements were also recorded across key demographic groups:
- Official Poverty Rate: The national official poverty rate fell by 0.5 percentage points to 10.2% in 2025.
- Historic Low for Hispanic Poverty: The official poverty rate for the U.S. Hispanic population dropped 1.2 percentage points to 13.9%, marking the lowest level on record for the demographic.
- Supplemental Poverty Measure (SPM): The national SPM rate—which accounts for government assistance programs, tax credits, geographic living costs, and necessary expenses—held statistically unchanged at 13.1%. The SPM rate exceeded the official poverty rate in 26 states and Washington, D.C.
Health Insurance Coverage and Medicaid Declines
Nationwide health insurance rates remained relatively stable overall, though public coverage saw notable internal shifts. An estimated 26.7 million people (7.9% of the population) were uninsured for the entire 2025 calendar year, a figure statistically unchanged from 2024.
Employment-based health insurance remained the most prevalent coverage type at 53.5%, followed by Medicare at 20.1% and Medicaid at 17.1%.
However, overall Medicaid coverage declined for the second consecutive year. The drop reflects ongoing nationwide shifts in state-level eligibility determinations, policy updates, and enrollment processes that began following emergency pandemic-era policy adjustments. Public coverage for working-age adults (ages 19 to 64) fell 0.5 percentage points to 17.3%, driven primarily by a 0.6-percentage-point decrease in Medicaid participation within that age bracket.