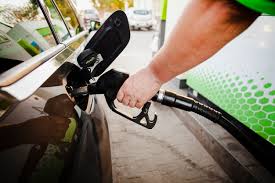
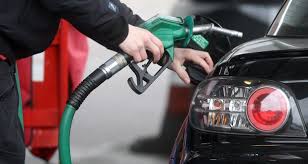
UNDATED – Indiana gas prices fell 1.8 cents per gallon in the past week, averaging $2.70 a gallon on Monday, according to GasBuddy’s daily survey of 3,271 stations in Indiana.
Gas prices in Indiana are 23.1 cents per gallon higher than a month ago and stand 72.1 cents per gallon higher than a year ago.
Gas prices in Lawrence County on Monday ranged from a low of $2.58 per gallon to a high of $2.65 a gallon.
According to GasBuddy price reports, the cheapest station in Indiana was priced at $2.39/g Monday while the most expensive was $3.09/g, a difference of 70.0 cents per gallon. The lowest price in the state Monday was $2.39/g while the highest was $3.09/g, a difference of 70.0 cents per gallon.
The national average price of gasoline has risen 5.9 cents per gallon in the last week, averaging $2.86/g today. The national average is up 33.2 cents per gallon from a month ago and stands 64.0 cents per gallon higher than a year ago.
Historical gasoline prices in Indiana and the national average going back ten years:
- March 15, 2020: $1.98/g (U.S. Average: $2.22/g)
- March 15, 2019: $2.45/g (U.S. Average: $2.54/g)
- March 15, 2018: $2.54/g (U.S. Average: $2.52/g)
- March 15, 2017: $2.11/g (U.S. Average: $2.28/g)
- March 15, 2016: $1.90/g (U.S. Average: $1.94/g)
- March 15, 2015: $2.19/g (U.S. Average: $2.43/g)
- March 15, 2014: $3.71/g (U.S. Average: $3.52/g)
- March 15, 2013: $3.75/g (U.S. Average: $3.69/g)
- March 15, 2012: $3.90/g (U.S. Average: $3.82/g)
- March 15, 2011: $3.56/g (U.S. Average: $3.56/g)

“As Americans turn optimistic on COVID-19 pandemic recovery, we’ve been seeing insatiable demand for gasoline, which continues to recover far faster than oil production. According to GasBuddy data, last week’s gasoline demand was just 1% below the pre-pandemic level, an extremely bullish factor likely to continue driving gas and oil prices up in the short term,” said Patrick De Haan, head of petroleum analysis for GasBuddy. “The recovery in the last few weeks has been astounding- both the speed and overall volume increases we’ve seen in our data lend credibility to the recovery, and perhaps will lead to continued price increases due to the continued imbalance between supply and demand. It’s no longer a question of if we’ll see gasoline demand return to near normal this year but when, and will oil producers rise to the occasion and be able to quickly ramp up output, or are we going to see the highest summer prices since 2014 until they jump into action? Only time will tell, but it’s looking like things are heating up far more than expected since the start of the year.”
GasBuddy is the authoritative voice for gas prices and the only source for station-level data spanning nearly two decades. Unlike AAA’s once-daily survey covering credit card transactions at 100,000 stations and the Lundberg Survey, updated once every two weeks based on 7,000 gas stations, GasBuddy’s survey updates 288 times every day from the most diverse list of sources covering nearly 150,000 stations nationwide, the most comprehensive and up-to-date in the country. GasBuddy data is accessible at http://FuelInsights.GasBuddy.com.