UNDATED – Indiana gas prices have risen 9.7 cents per gallon in the past week, averaging $2.73 a gallon today, according to GasBuddy’s daily survey of 3,271 stations in Indiana.
Gas prices in Indiana are 33.1 cents per gallon higher than a month ago and stand 44.4 cents per gallon higher than a year ago.
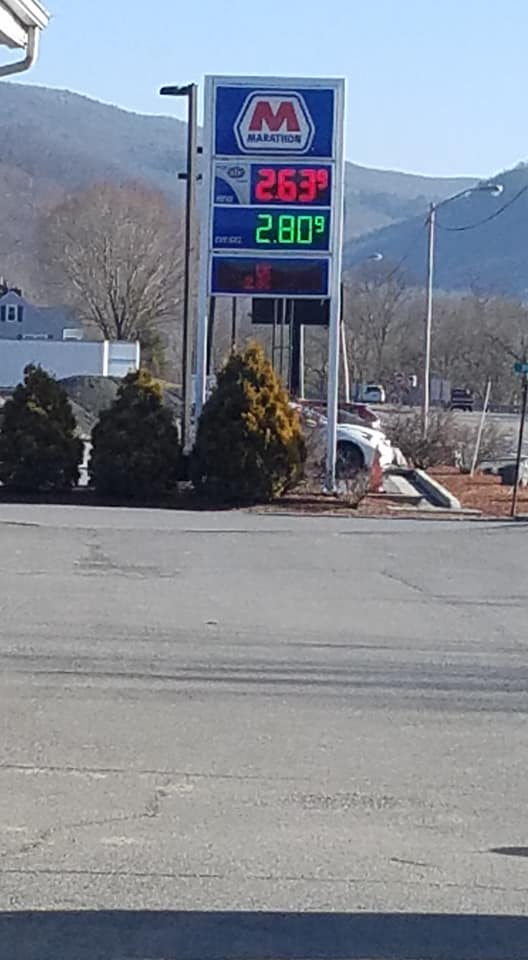
The lowest gas prices in Lawrence County on average is $2.65 a gallon for regular. A few stations have gas at a lower price. At Cenex in Mitchell regular is $2.45 a gallon, at the Marathon, Sixty Eastside, and Sinclair stations gas is $2.59 a gallon for regular.
According to GasBuddy price reports, the cheapest station in Indiana is priced at $2.45 a gallon today while the most expensive is $2.99 a gallon, a difference of 54.0 cents per gallon. The lowest price in the state today is $2.45 a gallon while the highest is $2.99 a gallon, a difference of 54.0 cents per gallon.
The national average price of gasoline has risen 7.5 cents per gallon in the last week, averaging $2.72 a gallon today. The national average is up 30.3 cents per gallon from a month ago and stands 30.6 cents per gallon higher than a year ago.
Historical gasoline prices in Indiana and the national average going back ten years:
- March 1, 2020: $2.28/g (U.S. Average: $2.41/g)
- March 1, 2019: $2.33/g (U.S. Average: $2.42/g)
- March 1, 2018: $2.49/g (U.S. Average: $2.54/g)
- March 1, 2017: $2.31/g (U.S. Average: $2.32/g)
- March 1, 2016: $1.70/g (U.S. Average: $1.76/g)
- March 1, 2015: $2.36/g (U.S. Average: $2.42/g)
- March 1, 2014: $3.63/g (U.S. Average: $3.45/g)
- March 1, 2013: $3.80/g (U.S. Average: $3.77/g)
- March 1, 2012: $3.81/g (U.S. Average: $3.74/g)
- March 1, 2011: $3.41/g (U.S. Average: $3.37/g)

“Gas prices continued to surge last week following cold weather-related shutdowns in Texas, but going forward, the impact from the cold has likely run its course. However, several other factors will rise in their influence on gas prices again, including the fact that gasoline demand continues up steam,” said Patrick DeHaan, head of petroleum analysis for GasBuddy. “According to Pay with GasBuddy data, last week’s total gasoline demand soared to the highest level since the pandemic began as COVD-19 cases continue to drop and Americans are filling up more. On the supply side, the number of oil rigs active in the U.S. stands nearly 50 percent lower than a year ago, which is a large factor driving prices up. To put it simply, demand is recovering much much faster than oil production levels, which is why oil prices have soared. This week, OPEC will be meeting to hopefully increase oil production to temper the rise in prices, but will they increase oil production enough to match the growing appetite of a global economy that’s seen oil demand jump? We’ll have to wait and see.”
GasBuddy is the authoritative voice for gas prices and the only source for station-level data spanning nearly two decades. Unlike AAA’s once-daily survey covering credit card transactions at 100,000 stations and the Lundberg Survey, updated once every two weeks based on 7,000 gas stations, GasBuddy’s survey updates 288 times every day from the most diverse list of sources covering nearly 150,000 stations nationwide, the most comprehensive and up-to-date in the country. GasBuddy data is accessible at http://FuelInsights.GasBuddy.com.