INDIANA – Every Indiana county, state legislative district, and Congressional district has a gap in affordable homes and a rate of severe housing cost burden that is concentrated at the lower end of the income spectrum, according to new data released by Prosperity Indiana and the National Low Income Housing Coalition.
See the updated 2026 ‘The Gap’ local and district data maps at Prosperity Indiana’s Housing4Hoosiers page: https://housing4hoosiers.org/the-gap-2026-maps/.
The new data, released as a supplement to the Indiana 2026 edition of The Gap: A Shortage of Affordable Homes adds additional perspectives on the lack of supply of affordable rental homes and the rate of housing cost burden by county and legislative districts at the state House, Senate, and Congressional levels.
Indiana is currently tied for the lowest rate of affordable and available homes in the Midwest, with only 34 units available for every 100 extremely low-income (ELI) households.
The new county and district-level data demonstrate that Indiana’s housing shortage and affordability crisis is statewide and affects rural, suburban, and urban communities alike. In every Indiana county, state, and Congressional district, the gap in affordable and available rental homes is primarily experienced by ELI households (those making below 30% of area median income) and very low-income households (those making below 50% of area median income). Those extremely- and very-low-income households are also the most likely to be severely housing cost burdened, meaning they must spend more than half of their monthly income on housing costs.
1. Lawrence County (County-Level)
- Affordable and Available Units: There is a significant deficit in units available for households at or below 30% of the Area Median Income (AMI).
- Severe Housing Cost Burden: Statewide, 74% of ELI renter households are severely cost-burdened (paying more than 50% of their income on housing). In Lawrence County, these rates typically mirror the state average, reflecting a critical shortage of stable housing for the most vulnerable residents.
2. State Legislative Districts (Lawrence County)
Lawrence County is primarily represented by the following districts in the Indiana General Assembly:
- State Senate District 44: (Currently represented by Eric Koch).
- The Gap Statistic: Senate District 44 historically faces a deficit of nearly 1,000 to 1,200 affordable units for ELI renters.
- State House District 62: (Currently represented by Dave Hall) and District 65 (Currently represented by Chris May).
- The Gap Statistic: These districts show that for every 100 ELI households, there are consistently fewer than 40 affordable and available units, leaving a majority of low-income families in these areas severely cost-burdened.
3. US Congressional District (Federal Level)
- 9th Congressional District: (Represented by Erin Houchin).
- The Gap Statistic: For the first time in 2026, the report includes federal-level data. The 9th District, which encompasses Lawrence County, shows a shortage of over 13,000 affordable and available rental homes for extremely low-income households across the entire district.
For the most precise interactive viewing, you can visit the Housing4Hoosiers Interactive Maps and hover over Lawrence County (located in the south-central portion of the state) to see the live data points for the deficit of units and the percentage of households burdened by cost.
This new data provides insights into the state-level report’s finding that Indiana’s rate of affordable and available rental homes for the most vulnerable renter households is now tied for lowest in the Midwest and is below the national average, with only 34 affordable and available homes for every 100 extremely low-income (ELI) Hoosier renter households. The state-level report also found that the rate of severe housing cost burden for ELI households is now the second-highest in the Midwest at 74%.
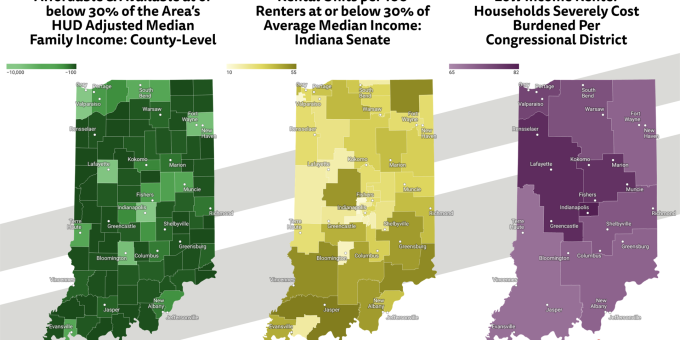
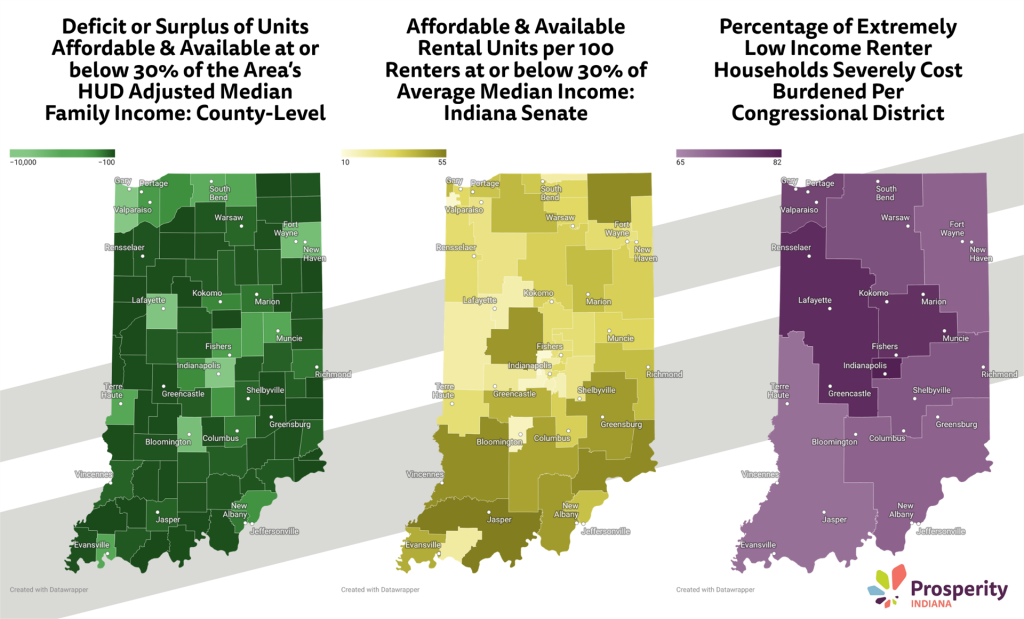
With Indiana tied for the top ‘hot spot’ for lack of affordable homes in the Midwest, many Indiana counties and legislative districts below the state average of 34 affordable and available homes per 100 ELI households are now ‘hot spots within a hot spot’ for unaffordability. For example:
- In the Indiana Senate, there are no more than 55 affordable and available homes for every 100 ELI renter households in any district, and as few as 12 (District 29).
- In the Indiana House, there are no more than 59 affordable and available homes for every 100 ELI renter households in any district, and as few as 1 (District 39).
- Among Indiana’s Congressional Districts, there are no more than 40 affordable and available homes for every 100 ELI renter households in any district, and as few as 25 (District 7).
- Among all 92 Indiana Counties, there are no more than 83 affordable and available homes for every 100 ELI renter households in any county, and as few as 14 (Tippecanoe County).
The maps can also be used to find the deficit of affordable and available homes, and the rate of severe housing cost burden for ELI households at the county, Congressional, and state legislative district levels.
Throughout 2026, Prosperity Indiana will use the data in these maps as part of participation in the national Our Homes, Our Votes nonpartisan voter education and candidate engagement initiative. Partners are encouraged to use these maps and data when asking state and federal candidates and elected officials about their plans to address Indiana’s housing supply and affordability crisis. Prosperity Indiana staff are also available to answer questions about ‘The Gap’ and can provide members with additional analysis about the data affecting their service areas.
Data for these maps was provided by the National Low Income Housing Coalition, with maps and analysis provided by Prosperity Indiana. The source for the data is HUD’s Comprehensive Housing Affordability Strategy (CHAS) data for 2018-22, the most recent available for the geographic levels presented here.