INDIANA — The Purdue University/CME Group Ag Economy Barometer leveled off after two months of sharp declines, down just 3 points to a reading of 134 in July.
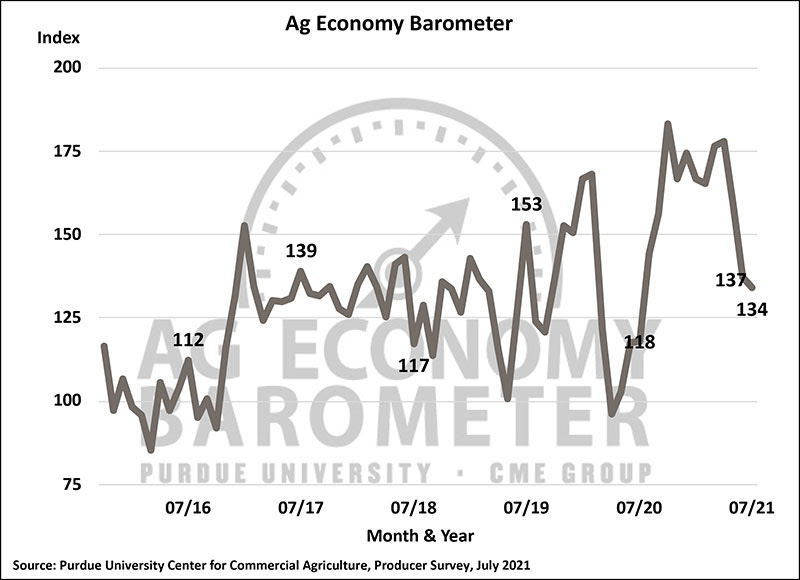
Both producers’ sentiment regarding current and future conditions also dropped. The Index of Current Conditions was down 6 points to a reading of 143, primarily as a result of weakened principal crop prices. The Index of Future Expectations was down 2 points to a reading of 130. The Ag Economy Barometer is calculated each month from 400 U.S. agricultural producers’ responses to a telephone survey. This month’s survey was conducted July 19-23.

“This month’s sentiment index marks the lowest barometer reading since July of 2020 and actually marks a return to sentiment readings observed from much of 2017 through 2019 when annual average barometer readings ranged from 131 to 133,” said James Mintert, the barometer’s principal investigator and director of Purdue University’s Center for Commercial Agriculture. “Producers’ sentiment regarding their farms’ financial condition was more optimistic when prices for corn, soybeans, and wheat were surging last fall, winter, and early spring. Still, recent sentiment readings suggest farmers remain cautiously optimistic about financial conditions on their farms.”
There was a modest improvement in the Farm Financial Performance Index, which asks producers about expectations for their farm’s financial performance this year compared to last year. The index improved 3 points from last month to a reading of 99 and remains 43 percent higher than in July 2020 when the index stood at 69.
The Farm Capital Investment Index declined for the fourth consecutive month, down 4 points to a reading of 50. Weakness in the investment index was primarily attributable to more producers indicating they plan to reduce their farm building and grain bin purchases in the upcoming year. Two-thirds of July’s respondents said their construction plans were lower than a year earlier, compared with 61 percent who indicated that in June. Plans for farm machinery purchases were also somewhat weaker, with a shift of more respondents planning to reduce their machinery purchases compared with last year instead of holding them constant.
Producers were also asked about their expectations for farm input prices. Just over half (51 percent) of the producers in the July survey expect input prices to rise 4 percent or more over the next year, 30 percent expect costs to rise 8 percent or more, and nearly one out of five (18 percentnt) expect input prices to rise by 12 percent or more.
“It is important to point out that these expectations are markedly higher than the rate of 1.8 percent per year that input prices rose over the last decade,” Mintert said.
Farmers remain optimistic about farmland values, although recent value increases could make some producers more cautious about where land values are headed in the next one to five years. The Short-Term Farmland Values Expectations Index weakened this month to a reading of 142, down 6 points from June, and the long-term index weakened to a reading of 151, down 4 points from a month earlier. While both indices remain near all-time highs, Mintert suggests recent declines in the farmland indices could be more of a reflection of the rapid increase in farmland values over the last year, leading producers to be cautious about the likelihood of further price increases. For example, Purdue University’s annual Farmland Values and Cash Rent Survey, conducted in June and published in late July, indicated that Indiana cropland values rose 12 percent to 14 percent, depending on land quality, compared with the June 2020 survey results.
Finally, both the June and July barometer surveys included questions on leasing farmland for solar energy production. The percentage of all respondents who have engaged in solar energy leasing discussions ranged from 6% (July survey) to 9% (June survey). New to the July survey, producers were also asked if either they or one of their landlords had signed a solar leasing contract, with 4 percent indicating an agreement had been signed. In a follow-up question on both surveys, producers were asked about the lease rates being offered by solar leasing companies. In July, more respondents reported lease rates being offered that were greater than $1,000 per acre than on the June survey. However, Mintert noted that more information is needed, as the number of respondents reporting lease rates remains quite low and the rates are variable.
Read the full Ag Economy Barometer report online. This month’s report includes additional insight into producers’ thoughts on farmland cash rental rates and the Executive Order on Promoting Competition in the American Economy signed in early July by President Biden. The site also offers additional resources – such as past reports, charts, and survey methodology – and a form to sign up for monthly barometer email updates and webinars.
Each month, the Purdue Center for Commercial Agriculture provides a short video analysis of the barometer results, available online. For even more information, check out the Purdue Commercial AgCast podcast. It includes a detailed breakdown of each month’s barometer, in addition to a discussion of recent agricultural news that affects farmers.
The Ag Economy Barometer, Index of Current Conditions, and Index of Future Expectations are available on the Bloomberg Terminal under the following ticker symbols: AGECBARO, AGECCURC, and AGECFTEX.
About the Purdue University Center for Commercial Agriculture
The Center for Commercial Agriculture was founded in 2011 to provide professional development and educational programs for farmers. Housed within Purdue University’s Department of Agricultural Economics, the center’s faculty and staff develop and execute research and educational programs that address the different needs of managing in today’s business environment.
About CME Group
As the world’s leading and most diverse derivatives marketplace, CME Group (www.cmegroup.com) enable clients to trade futures, options, cash, and OTC markets optimize portfolios and analyze data – empowering market participants worldwide to efficiently manage risk and capture opportunities. CME Group exchanges offer the widest range of global benchmark products across all major asset classes based on interest rates, equity indexes, foreign exchange, energy, agricultural products, and metals. The company offers futures and options on futures trading through the CME Globex® platform, fixed income trading via BrokerTec, and foreign exchange trading on the EBS platform. In addition, it operates one of the world’s leading central counterparty clearing providers, CME Clearing. With a range of pre-and post-trade products and services underpinning the entire lifecycle of a trade, CME Group also offers optimization and reconciliation services through TriOptima, and trade processing services through Traiana.
CME Group, the Globe logo, CME, Chicago Mercantile Exchange, Globex, and E-mini are trademarks of Chicago Mercantile Exchange Inc. CBOT and Chicago Board of Trade are trademarks of Board of Trade of the City of Chicago, Inc. NYMEX, New York Mercantile Exchange and ClearPort are trademarks of New York Mercantile Exchange, Inc. COMEX is a trademark of Commodity Exchange, Inc. BrokerTec, EBS, TriOptima, and Traiana are trademarks of BrokerTec Europe LTD, EBS Group LTD, TriOptima AB, and Traiana, Inc., respectively. Dow Jones, Dow Jones Industrial Average, S&P 500, and S&P are service and/or trademarks of Dow Jones Trademark Holdings LLC, Standard & Poor’s Financial Services LLC and S&P/Dow Jones Indices LLC, as the case may be, and have been licensed for use by Chicago Mercantile Exchange Inc. All other trademarks are the property of their respective owners.
Information: Kami Goodwin,, kami@purdue.edu
Source: James Mintert, 765-494-7004, jmintert@purdue.edu
Related websites:
Purdue University Center for Commercial Agriculture: http://purdue.edu/commercialag
CME Group: http://www.cmegroup.com/
Agricultural Communications: (765) 494-8415;
Maureen Manier, Department Head, mmanier@purdue.edu